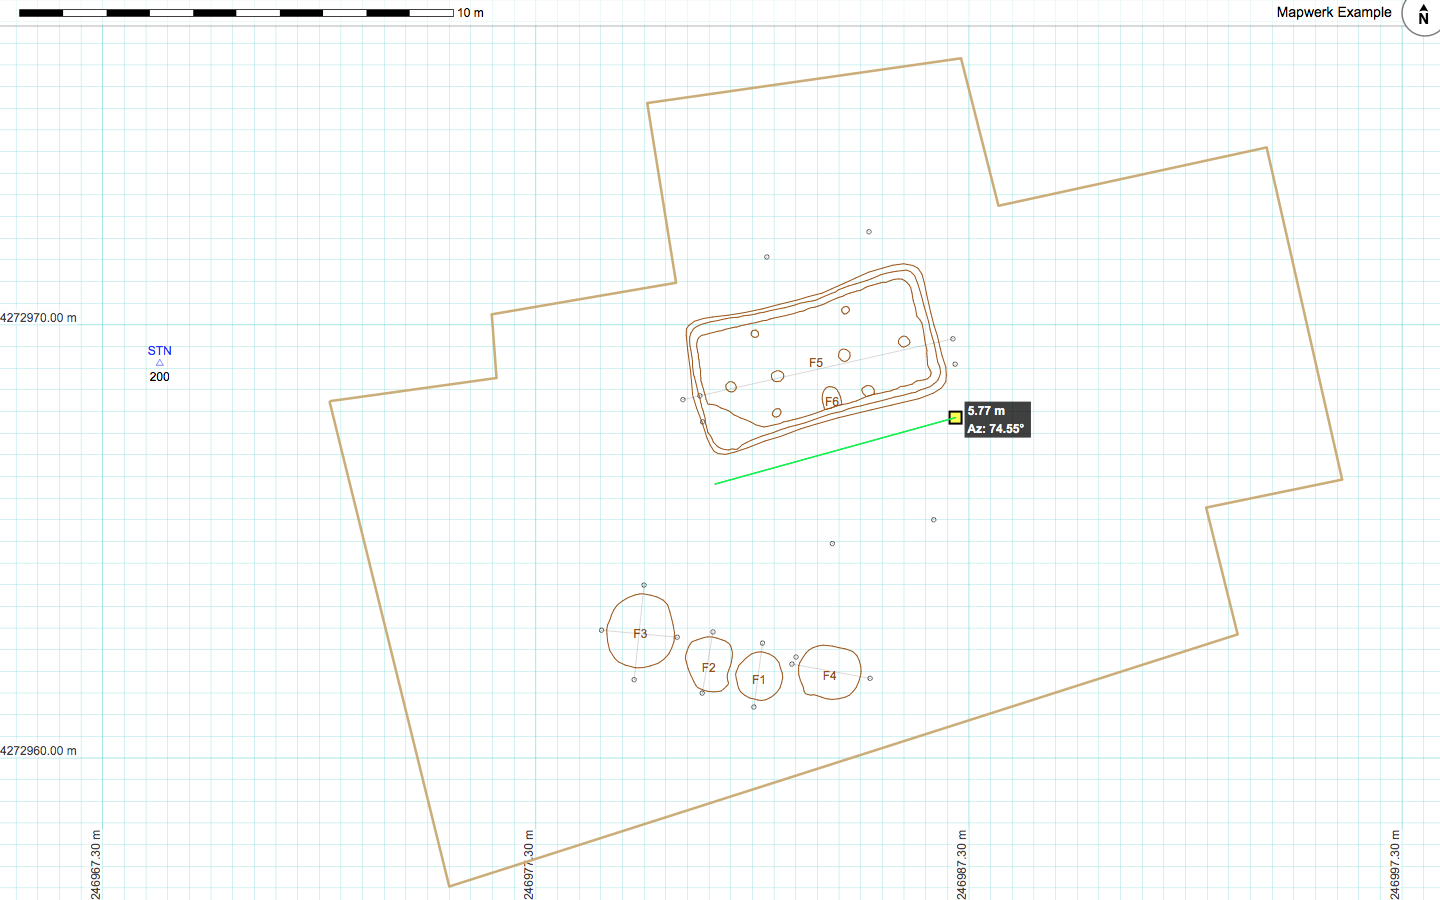
It is extremely suitable for compiling scale imagery from multiple sources and making really nice figures suitable for professional documents.
Mapwerk can be used to import and visualize XYZ total station data, digitize scale drawings, map along a baseline, freeform sketch to scale, stitch together multiple scale drawings, measure distance/area/perimeter, and plenty more.
Intuitive and powerful selection and transformation tools allow granular control of individual vertices spanning multiple layers.
Mapwerk offers a refined interface, built from the ground up with a fresh perspective. A new approach to radial menus brings many often-used controls within mouse reach and greatly declutters the UI.
Details and full feature list can be found on the Mapwerk website.

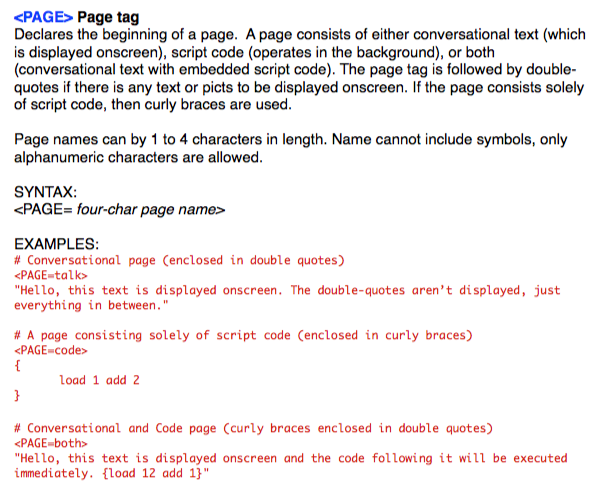
Below is a screen grab from the reference manual showing a sample of the syntax. Onscreen text is displayed using double-quotes. Behind-the-scenes coding used a rudimentary assembly-like syntax which supported variables and allowed mathematical operations, bit-shifting, boolean operations, branching, random number generation, string/number conversion, and a messaging system to communicate with the host application.

Demonstration GIFs forthcoming!
Demonstration GIFs forthcoming!
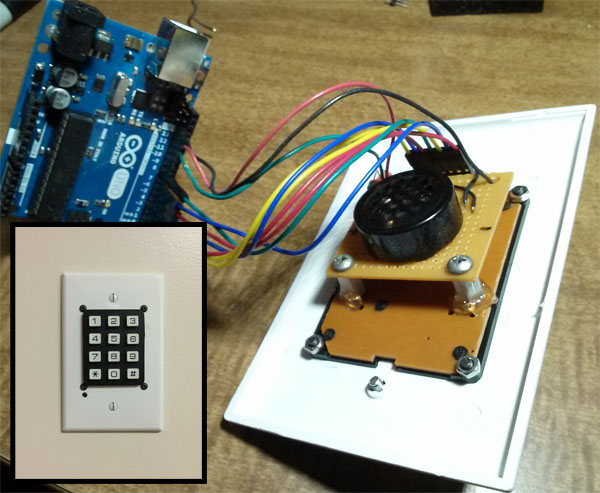
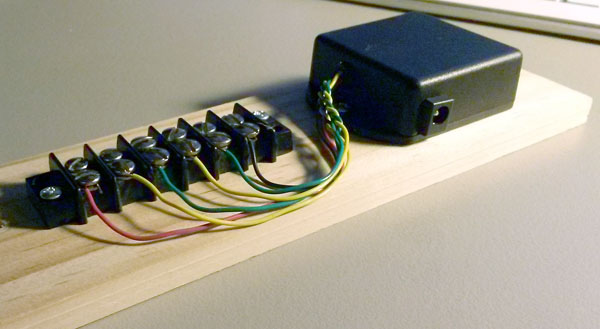
The system utilizes C-style Ardiuno code as well as Python scripting to handle alarm events.

